Back
PharmaBench
The standard for evaluating frontier model on clinical development documentation

Overview
Taking a drug from idea to approval runs on documents required to meet strict regulatory standards. Teams of experts write protocols, analysis plans, study reports, safety narratives, and answers to regulatory questions. Any small errors matter, and impact the review and approval process. PharmaBench tests whether AI agents can do this work.
An agent is placed inside a complete drug program, given a short request and every document the program has produced so far, and graded against the rubric of the expert who wrote the task. The details have to be right, they have to be traceable, and nothing can be claimed that the evidence does not support. Every finding below ties back to those requirements.
Model scoreboard
Experts wrote 120 tasks across 8 drug programs and graded every answer against their own rubric. We ran 10 frontier models three times on each task. Each run is graded against the task's rubric, a weighted list of what the answer must contain and what it must not contain.
A run passes when it meets every required criterion and triggers no penalty. Pass rate is the share of a model's runs that pass. Mean score is the average share of rubric points earned, which shows how close the other runs came.
Why pass rate and mean score
A model could earn a high mean score, for example 90%, but the missing 10% can be an error that affects an outcome, not just immediately but in all related downstream documentation where that outcome is referenced.
A user does not know if or how a model has failed for a specific task or query. Reviewing and confirming the model's output reduces the time and effort savings that AI models promise.
Both the pass rate (application based, across tasks) and the mean score (technical, within task) should be included, as they are complementary rather than exclusionary.
Headline findings
Six findings shape how these results should be read. Each is stated plainly first, then supported in the sections below.
1. Full marks are rare for every model.
The best model, Muse Wonder, earned full marks on 17.2% of its runs, and GPT 6 Astra on 16.1%. Across all ten models, 12.0% of runs earned full marks, and 63 of the 120 tasks were never fully solved.
2. Penalties account for most of the gap between leading models, with one exception.
A penalty in this benchmark is not a missed point. It marks something the answer added that an expert reviewer would have to find and remove before the document could be used: content that is not in the source documents, a claim the evidence does not support, or a conclusion that goes beyond what the study can show. In one task, a model described what a prescriber guide and patient card contain, though neither was in the files it was given. The leading models cover a similar share of what the experts required. What separates them is how often they add content of this kind: GPT 6 Astra triggers at least one penalty in 29% of its runs, Opus 5 in 65%. Muse Wonder is the exception: it leads by covering more of what the experts required, with 0.872 in credit against 0.779 to 0.837 for the other nine models, while triggering a penalty in 47% of its runs.
3. Regulatory review separates models more than any other group.
It has the lowest mean score and the widest gap between the best and worst model, and only 4.9% of its runs pass. Data analysis is the only group where a fifth of runs pass. Biostatistics is the highest scoring skill, with a mean score of 0.856.
4. Formatting instructions are often ignored.
Some tasks ask for continuous prose without bullet points, or set a word limit. Most runs do not follow these instructions, including runs from the leading models. 24% of runs wrote continuous prose without bullets when asked to, across 18 tasks, and 48% of runs stayed within a stated word limit, across 12 tasks. Formatting is a small part of the overall result, though. These instructions apply to at most 30 of the 120 tasks, so at least 33 of the 63 tasks that were never fully solved carry no formatting instruction at all, and at least 87% of all lost rubric points fall in categories unrelated to format: numbers missed or misstated, conclusions not drawn, discrepancies not flagged, and claims the evidence does not support.
5. Agents find the right documents. Scores depend on what they do with them.
A typical run opens about 9 of the roughly 120 files it receives and reaches most of the documents the task author relied on. Runs that open more files do not score higher (within task rank correlation 0.01).
6. Some tasks are hard for every model.
On 8 of the 120 tasks, no model averages above 0.70. On these tasks, models most often miss a gap or discrepancy the task was built around, or a specific number from the data. Penalties matter less here than elsewhere.
Benchmark overview
Every clinical trial produces thousands of pages of required documentation: protocols, statistical analysis plans, case report forms, patient level datasets, a clinical study report, and the safety and regulatory documents that follow. The details have to be right, they have to be traceable, and product approval depends on the accuracy. The people who write and check them also have to say clearly what the evidence does not show.
PharmaBench tasks sit inside complete synthetic drug programs inspired by real drug programs, each with a sponsor, a product, and clinical studies from Phase 1 to Phase 3. Biostatisticians, medical writers, safety physicians, regulatory specialists and clinical reviewers wrote the tasks. They cover four kinds of work: data analysis, document structure, medical writing, and regulatory review.
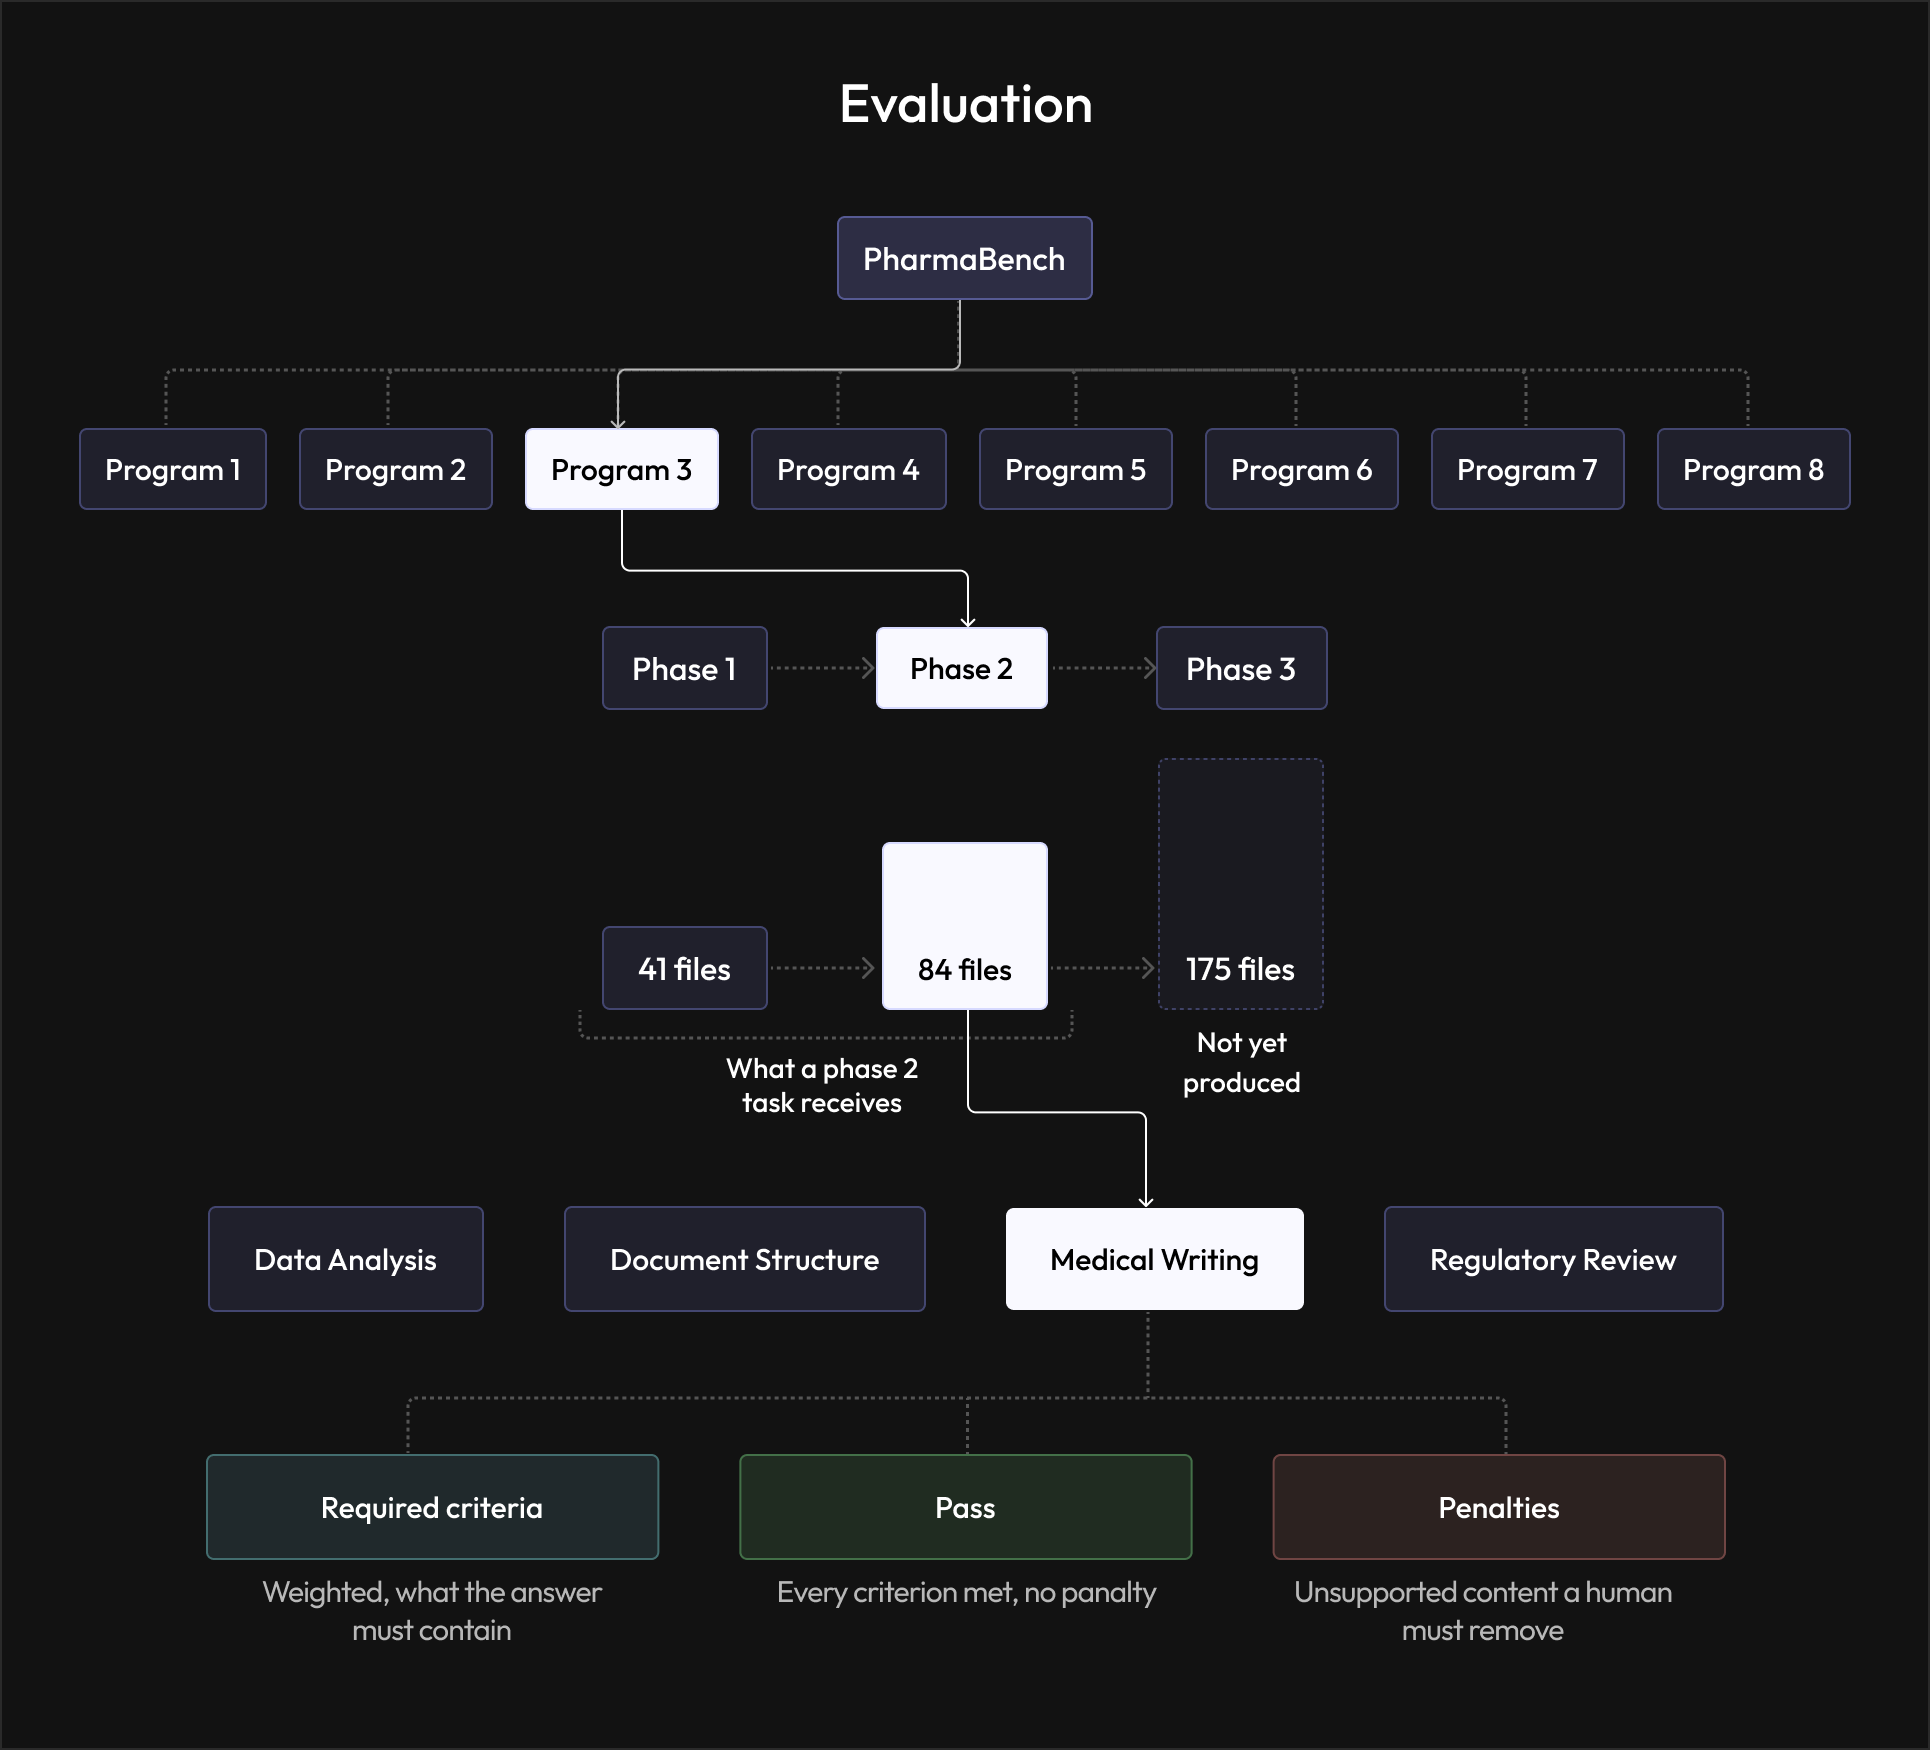
Programs (1-8)
PharmaBench is built around eight synthetic drug programs, each with its own sponsor, product and indication, modeled on real development programs
Lifecycle (Phase 1, 2, 3)
Each program runs from Phase 1 to Phase 3, and its files build up along the way. Each task receives only what existed at its point in the program
Kinds of work (Data analysis, Document structure etc.)
Each program holds 15 tasks written by biostatisticians, medical writers, safety physicians and regulatory specialists, spread across four kinds of work
Checks (Required criteria, Pass, Penalties)
Each run is graded against the expert's rubric: weighted criteria the answer must meet, and penalties for content it must not contain
An agent gets a short request, and every document the program has produced up to that point, often more than a hundred PDFs and datasets. It works in a sandbox with a shell and Python, and writes its answer to a file. Below is everything one task gives the agent.
- Task
- PB-0070, regulatory review, Kelvaparib program, study KLV-7701.
- Request
- “Assess whether the proposed risk minimization for the kelvaparib program (informing study KLV-7701) is proportionate to the observed risk, focusing on the balance of routine and additional risk minimization. Consider severity, preventability and practicality, and identify the gaps. Write the summary as text only (no tables) and without point-form.”
- Files
- 250 files: 206 PDF documents and 44 CSV datasets from 4 studies in the program.
- Needed
- Two of those files carry the answer: the risk management plan and the product information. Nothing in the request says which.
- Output
- A written answer saved to a file in the sandbox.
One task as the agent receives it. The request is quoted as written.
Every file the agent receives
Loading files…
Task taxonomy
Tasks are organized by kind of work and, within each, by skill. Pass rates and mean scores below are pooled across all ten models.
Table 1. The 120 tasks by kind of work. The last column is the gap in mean score between the best and worst model on that kind of work. Each skill's mean score is shown beside it.
Every task lives inside a complete drug program
Each program has 15 tasks with the same mix of skills, spread across its three phases. A task gets the program as it stood at that point, so later tasks work from more evidence: a median of 41 files in Phase 1, 84 in Phase 2 and 175 in Phase 3. Pick a program to see its studies and tasks.
Choose one of the eight synthetic programs to see its studies and tasks. Sponsors, products and study identifiers are invented.
Performance summary
Table 3. Scoreboard order. Mean score is the credit for required criteria met, less the amount lost to penalties. Intervals are 95% bootstrap intervals over tasks.
The two results order the field differently in the middle. Fable 5.1 is fourth on pass rate and sixth on mean score; Grok 4.6 is tied for third on mean score and fifth on pass rate. Most intervals overlap, including those of Muse Wonder and GPT 6 Astra at the top, so differences of a few points should be read as ties. Among the other nine models, credit for required criteria ranges only from 0.820 to 0.837 across the top seven by mean score, which is why penalties decide most of their ordering. Muse Wonder earns 0.872, the most of any model, and leads although it loses more to penalties than GPT 6 Astra, 0.063 against 0.034.
Pass rate and mean score by kind of work
Where points are lost
Most lost points come from answers that address the right question but miss the specific item the expert asked for: a number from a dataset, a discrepancy between documents, or a required conclusion. Penalties account for 27% of lost points. Most of that is content the sources do not support or a claim that overreaches; breaking a length, format or scope rule accounts for only 4% of lost points.
Figure 8. Share of all rubric points lost across 3,600 runs, by category. Categories are assigned from the judge's reasoning on each criterion; a hand check of a sample agreed in about 9 of 10 cases. Figure 6 shows the same split on the 8 tasks where no model averages above 0.70.
Hardest tasks: where every model fell short
On 8 of the 120 tasks, no model averages above 0.70. 51% of the points lost on these tasks come from answers that address the right point but leave out part of what the rubric requires, compared with 38% across all tasks. 34 required criteria on these tasks were missed by at least 27 of the 30 runs. The five tasks with the lowest mean score are listed below.
| Task | Skill | What the task asks for | Mean score, all models | Best model average |
|---|---|---|---|---|
| PB-0172 | Document Compliance | Appendix assembly and completeness | 0.142 | GPT 6 Astra, 0.364 |
| PB-0051 | Safety Synthesis | Aggregate periodic safety writing | 0.287 | Gemini 3.8 Flash, 0.432 |
| PB-0036 | Regulatory Response | Response requiring a new analysis to be run and reported | 0.368 | Fable 5.1, 0.506 |
| PB-0142 | Regulatory Review | Benefit risk exposure assessment | 0.396 | GPT 6 Astra, 0.491 |
| PB-0136 | Document Compliance | Checklist audit producing a graded defect list | 0.455 | GPT 6 Astra, 0.647 |
Table 5. The five tasks with the lowest mean score across all ten models. No run passes any of them.
One task in detail
Task PB-0070 asks for a regulatory review of the risk management plan for kelvaparib, a PARP inhibitor for ovarian cancer. The plan lists three important risks and proposes two extra measures, a prescriber guide and a patient card, but neither document is in the files the agent receives. A correct answer says the routine measures are a proportionate foundation and that the extra measures cannot be judged from what was supplied. The request, quoted in the overview, does not mention that the two documents are missing, or that the product information gives one case count without its denominator. The agent has to notice both from the documents.
The answer depends on 2 of the 250 files the agent receives. Step through the request, the evidence, every model's runs and the grading.
Loading this task…
How models fall short: strong and weak runs on the same task
One task from each kind of work. In each, the documents do not settle something the request seems to ask for: a censoring choice the plan withdrew, a dose response the data cannot show, extra measures nobody supplied, a production order the plan never states. Strong runs stay with what the documents support. Weak runs fill the gap themselves.
Longer answers carry more content to remove
In clinical documentation every statement has to be traceable to the evidence, so anything a model adds beyond what the documents support has to be found and removed by hand before the output is usable. The models that write the most add the most of it. GPT 6 Astra writes the shortest answers in the field and loses the least to penalties. Opus 5 and Gemini 3.8 Flash write about three times as much and lose the most. Muse Wonder, which leads on both results, also writes about three times as much as GPT 6 Astra; it loses more to penalties and makes up for it with the highest credit for required criteria. Across the ten models, the rank correlation between median answer length and points lost to penalties is 0.88.
Table 7. Median answer length over all runs, share of runs that trigger at least one penalty, and mean score lost to penalties, in scoreboard order.
What this means for clinical documentation work
The best model passed around one run in six. Models usually found the right documents and completed most of each task with the required precision. They lost points on specific numbers, discrepancies they did not flag, and on claims the evidence did not support. Three takeaways follow.
- Read pass rate and mean score together.Mean scores of 0.67 to 0.81 say models complete most of each task. Pass rates of 5.6% to 17.2% say the complete, error free document is still uncommon, and the user cannot tell from the output which runs those are.
- Check what an answer adds, not only what it covers.Most leading models cover a similar share of what the experts required and separate on what they add beyond it. A draft that covers every point can still state something the documents do not support, and each such statement has to be found and removed before the document is usable.
- Verify the specifics.The largest sources of lost points are a specific number missed or misstated, a required conclusion not drawn, and a gap or discrepancy between documents that was not flagged. These are the items to check first in review.
Methodology note
Tasks
120 tasks across 8 drug programs, written and reviewed by practicing biostatisticians, medical writers, safety physicians, regulatory specialists and clinical reviewers. Each has a short request, the program's documents to date, a reference answer the agent never sees, and a weighted rubric with a median of 19 criteria, about one in five of them penalties.
Models and agents
Ten models: Muse Wonder, GPT 6 Astra, Muse Spark 1.3, Fable 5.1, Grok 4.6, Sonnet 5.5, Opus 5.5, Opus 5, Muse Spark 1.1 and Gemini 3.8 Flash. Every model ran as the same open source coding agent in an isolated sandbox with a shell, Python and document tools, and no internet access, at its provider's default reasoning settings. Each model ran each task 3 times, for 3,600 graded runs. Muse Wonder was added on 15 October 2026, on the same task versions with the same agent, sandbox and judge as the other nine.
Grading
An LLM judge checks each rubric criterion separately, with the reference answer as context. Rubric wording and expected values are not published; criteria on this page are paraphrased.
Statistics
Pass rate is the share of runs scoring 1.0, averaged over tasks. Mean score is the average reward over each task's 3 runs, averaged over tasks. Intervals are 95% bootstrap intervals over tasks.

